Google Optimize, a website optimization tool included in the Google Marketing Platform, has been used by thousands of webmasters to conduct A/B testing and improvement tracking. These features have proven invaluable to businesses, allowing for targeted experiments aimed at improving user experience and website performance. Google has now added personalization features, narrowing the capabilities gap between this free tool and commercial competitors.
The new personalization features can be used as a means to deploy a winning A/B experiment version or as a standalone feature to personalize content. In previous versions of “Optimize”, marketers had to manually deploy a winning experiment as a code or data change, or deploy as a separate experiment that targeted all users since Optimize does not allow changes to experiments once started. Similarly, personalizing content was a workaround at best. Targeting options for personalization in the free version of Google Optimize have steadily improved. They include mainstays like URL, referrer, cookie value, and device type, as well as some slick integrations with other Google Marketing Platform data such as Geography (using the Google Ads Geo Targeting API), Ad Groups, and Google Tag Manager data layer variables. Targeting by Analytics Audiences is still reserved for the paid version, Optimize 360.
A Word of Caution
We strongly recommend partnering with an experienced professional when setting up Google Optimize. While it’s possible to deploy the Optimize plugin via tag management solutions alone, it’s not recommended and will likely result in increased load time and the user experience nightmare known as the Flicker of Original Content (FoOC), when an original page is briefly displayed before the alternative appears. Poor implementation may lead to conflicts with tagging, analytics, and other JavaScript based libraries. In short, the byproducts of poor implementation are the opposite of the platform’s intent.
Other Options
Google is not the only solution for A/B testing and content personalization. VWO has been offering A/B and personalization for several years now. Optimizely is another option, albeit at a premium price.
On the enterprise end of the spectrum, all-in-one solutions such as Adobe Experience Platform and SalesForce Marketing Cloud have these features baked in, but are saddled with other modules which may not be necessary.
Contact us today to talk more about how we can optimize your website and apps to make sure they’re allowing a personalized experience for every visitor and customer.
User Experience
Getting information to your users faster is always better. Page speed scores may appear to be an arbitrary number that have more to do with the underlying technologies of a webpage, but improving them will automatically improve the experience for your users. Because more and more people have access to broadband connections and faster mobile speeds, when a page loads slowly it is far more obvious than it used to be. You can see how quickly users will drop a page in this infographic provided by Google from their own research: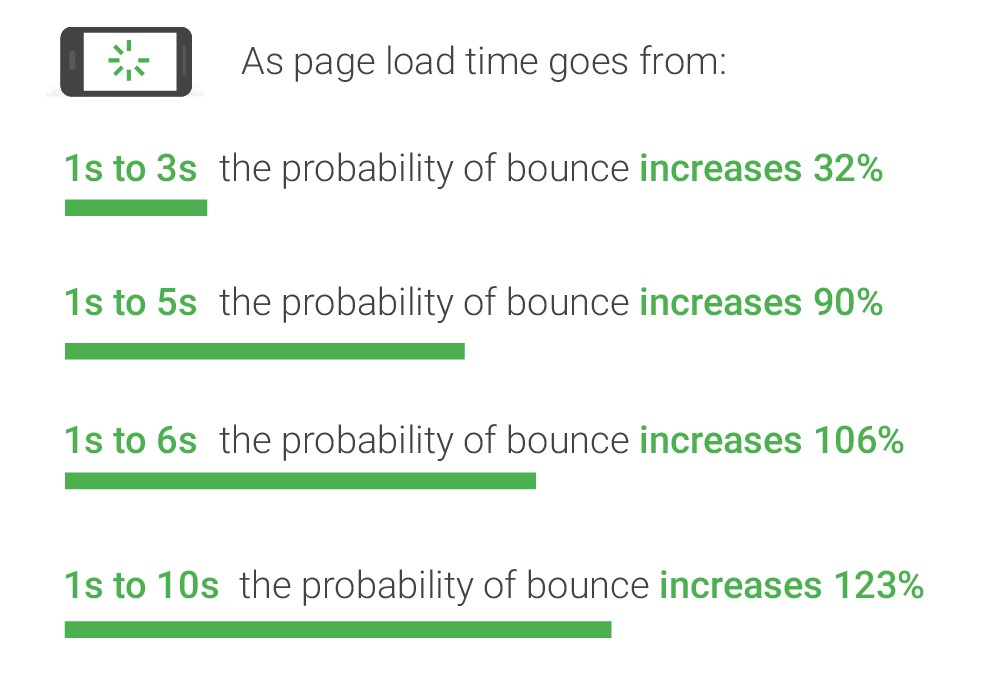
Additionally, users that experience a noticeably slow page are less likely to return to that site in the future. A slow site can give the impression that it is untrustworthy, which will also affect the likelihood of a user returning to the site.
Better Conversions
Research by Kissmetrics has shown that 40 percent of users will abandon a page that takes more than three seconds to load. This means that if you have a slow loading page, you could be losing a significant percentage of your conversions before they’ve even had a chance to view the page.
For e-commerce the difference can be even more distinct. Walmart demonstrated a 2 percent increase in their conversions for every one second improvement that they made to their page speed. They also showed a direct correlation between bounce rate and site speed: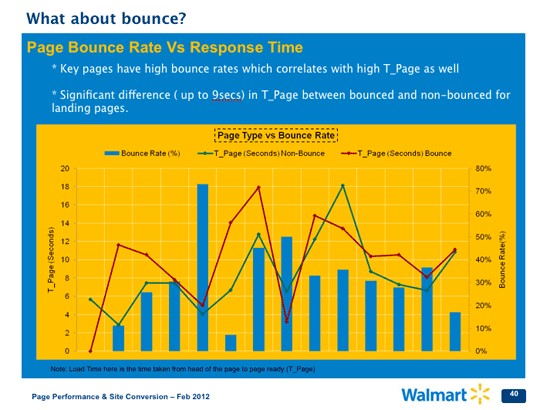
Improved Indexing
In 2010, Google Announced that page speed had become a ranking factor for websites. While having a fast site doesn’t automatically mean that you will rank higher than other sites with similar content, but it does mean you won’t be penalized for having a slow site.
In addition, when your site is being crawled by bots such as Google there is a factor that determines how quickly the indexing occurs. This is commonly referred to as Crawl Budget. According to Google:
“If the site responds really quickly for a while, the limit goes up, meaning more connections can be used to crawl. If the site slows down or responds with server errors, the limit goes down and Googlebot crawls less.”
What this means is that when your site is faster, the Googlebot is able to index more pages within its allotted crawl budget, which then helps your site content become indexed quicker.
Conclusion
Based on a number of factors outlined, there are direct, measurable benefits to improving your page speed. Make sure to check back for the final article in this series where we’ll cover ways that you can improve your site’s page speed without sacrificing the user experience or content quality.
Wondering where your website falls on the speed scale? Contact us today for a free assessment.
Have you ever experienced a webpage that took too long to load? Remember how frustrating that was? Well, you’re not alone. How fast (or slow) a page loads is a major contributing factor to page abandonment, and it plays an important role in your website’s SEO rankings, user experience and overall functionality.

According to surveys done by Akamai and Gomez.com, 40 percent of people will abandon a website that takes more than three seconds to load. For e-commerce sites, 52 percent of online shoppers state that quick page loading is important to their site loyalty.
This is the first in a series of posts focused on page speed. The following two posts in this series will cover why it’s important as well as some basic tips to improve your own page speed.
What is page speed?
Page speed is the amount of time it takes for a web page to become visible and fully interactive by a user. There are a few different metrics that are commonly used to measure this:
First Meaningful Paint
First meaningful paint is the first point that the page’s primary, above-the-fold content becomes visible. This can include any styles, fonts, or images that are critical to the display of the page. For example, if you’re using a custom web font for your page text and you’re not loading the font asynchronously, the first meaningful paint would not occur until that font has been loaded and appears on the page.
This is typically the most important of the metrics as it is directly visible to the user. If you reduce your first meaningful paint time from three seconds to 1.5 seconds, that is an obvious change that your users will experience.
First Interactive
First interactive is when the page has become minimally interactive for the user. Most, but not necessarily all, elements on the page are interactive and the page responds, on average, to most user input.
Consistently Interactive
A page would be consistently interactive when all functionality is available to user and there are no more than two active network connections in process. This would be when all interactive elements on the page that are part of the initial load have finished downloading and processing and are fully rendered.
By combining these three measurements we can get a good idea of how fast a page appears to load for the average user. When measuring these speeds it’s important to remember that not every user is going to have the same connection speed as you. For example, Google predicts that 70% of cellular network connections globally will occur at 3G or slower speeds through 2020. This is also the standard that Google uses to determine your site’s page speed score.
Part two of the Page Speed series answers the question why your page speed is so important.
Interested in your website’s page speeds? Contact us today for a free assessment.
I received a fantastic question from a client this week. The question was:
“Do you have an opinion regarding our New vs. Returning visitor ratio for external visits? It’s currently 74% Returning, 26% New.
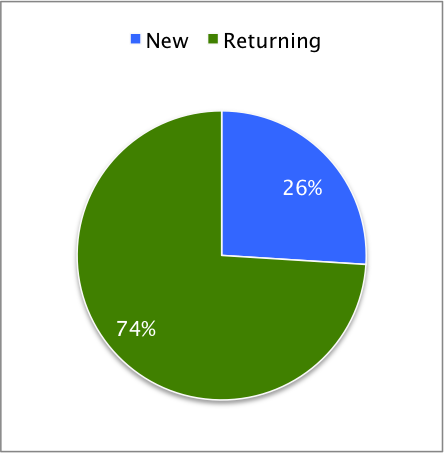
“I know the ratios will differ based on the type of site, business, etc, but I’m interested in learning what a good ratio might be for our company.”
To answer this question I have to first be mindful of the goals of each marketing initiative. Is the marketing working to bring in new visitors? Bring in returning visitors? What kind of visitor do I expect to see from each marketing channel and tactic?
Here is what I would expect to see from each marketing channel when analyzing the ration of New vs. Returning visitors.
Channel and Tactic Expectations
In general, without looking at specific metrics, I’d say this:
- Social media is commonly used to attract the attention of a larger audience or to engage an existing one. As an organization’s social media strategies become more advanced, there tends to be more engagement with their established audience and, therefore, a rise in the amount of returning visitors to the company’s website.
- Displayadvertising is most commonly meant to bring in new visitors Most clients use display advertising to find relevant new audience members on targeted websites with awareness ads. I’d expect to see mostly new visits from display, and I’d expect the quantity to be larger than social, but not by too much (depending on each clients display advertising budget).
- Organicsearch should be pretty even. My clients want to attract both new and returning visitors from organic search. I’d also expect this to be the largest driver of overall traffic, evening out the pie chart as much as possible.
- Email – From what I know of this particular client’s emailefforts, I’d expect that to be mostly returning visitors. I’d also expect the quantity to be small. However, each client’s email efforts will be different, so the quantity will vary as well as the visitor type. If the list comes from the company Customer Relationship Management system (CRM), I’d expect to see mostly returning visitors. If the email list is a purchased list of prospects, I’d expect to see more new visitors than returning.
- Directtraffic should be returning visitors, and I’d expect that to be the 2nd largest source after Organic search.
- Referral Traffic – I’d expect some new visits from referringlinks, but in order to get really good data from referral sources, we usually need to apply a lot of filters. I’d also expect that without these filters being applied, large quantities of sessions are being attributed to the referral medium. So after we look at the analytics, we’ll drill down to see if the referral source needs to be cleaned to get better data.
Channel and Tactic Metrics
Now that we’ve stated our expectations for each marketing channel, let’s open Google Analytics and see if data supports our hypothesis.
Here’s what we see in Analytics for this client since the beginning of the year:
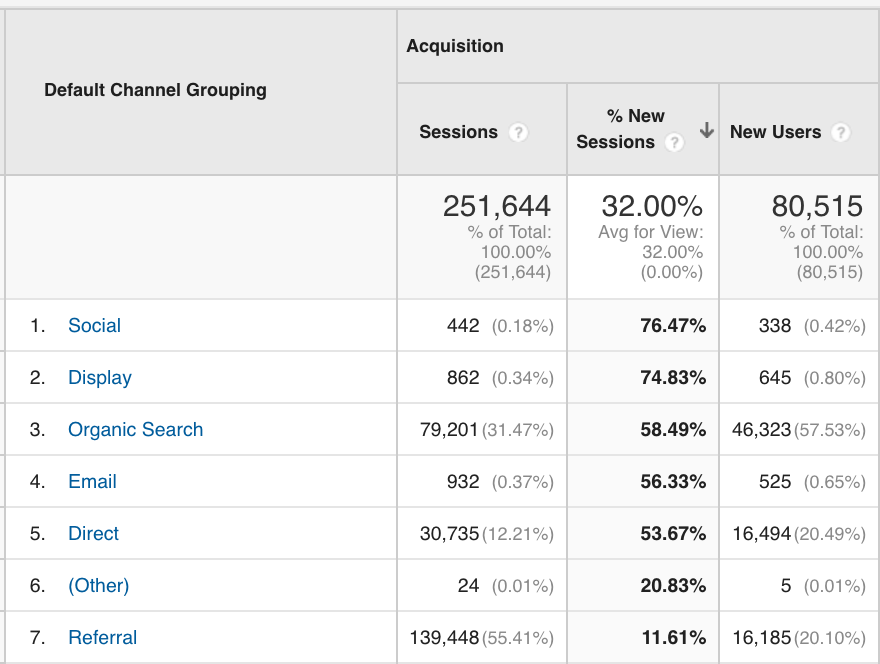
This is exactly what I’d expect to see.
Now that we’ve seen an overview of all marketing channels, next, drill into the Referral source. Since it’s a very large number of sessions, it will greatly affect the grand total of new vs. returning percentage of visitors. Known spam referral sources were found in this unfiltered data.
Once you’ve edited your custom segment to remove spam referral traffic, you should be able to get a better idea of the visitor type that is coming through from websites that link to yours.
Here’s the actual break down of new vs. returning visitors to this client’s website.
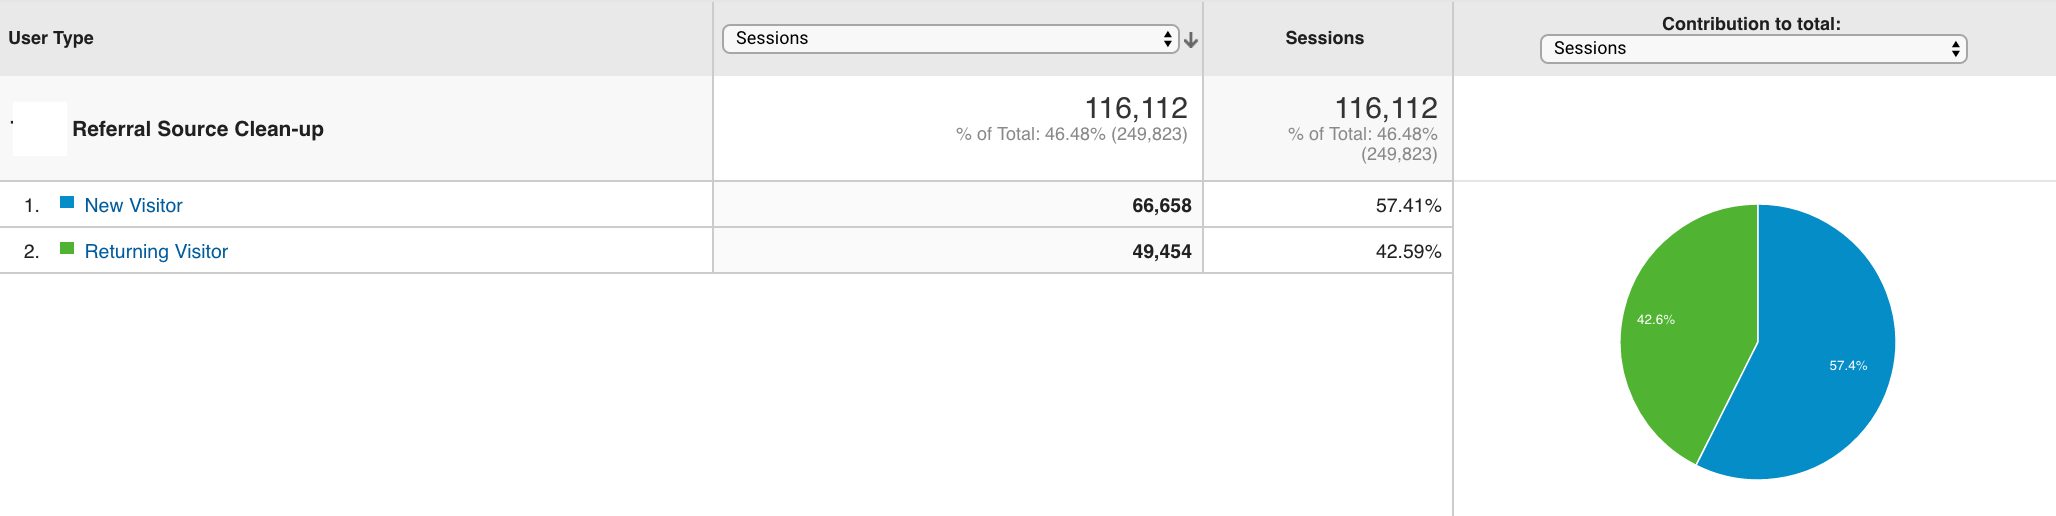
So while I can’t quite give a benchmark for what the ratio should be in your industry, we can definitely analyze the data to see if each marketing initiative is bringing in the type of visitor, and the quantity of visits, that your company expects.
I’ll add that we, as marketers, can change the balance of this pie chart. We’re very much in control of this. If our directors tell us that the goal for Q4 is to see the biggest increase in the amount of new customers, we can design a marketing strategy that will cause an increase in new visits to the site.
If our directors tell us that the goal for Q4 is to retain customers and drive deeper adoption, we can design a marketing strategy that will cause an increase in returning visitors.
If the directors tell us both, we shouldn’t look at the percentage metric, but rather the session count and look for an overall increase.
Thanks to my outstanding clients who ask great questions like this. If you have a question about gaining deeper insights from your Google Analytics, please don’t hesitate to get in contact with us.
Featured Image Ciation: Flickr Creative Commons – Nosha “Dormant”